Compared with NIST Webbook for Carbon Dioxide
(NIST data accessed in 2018)
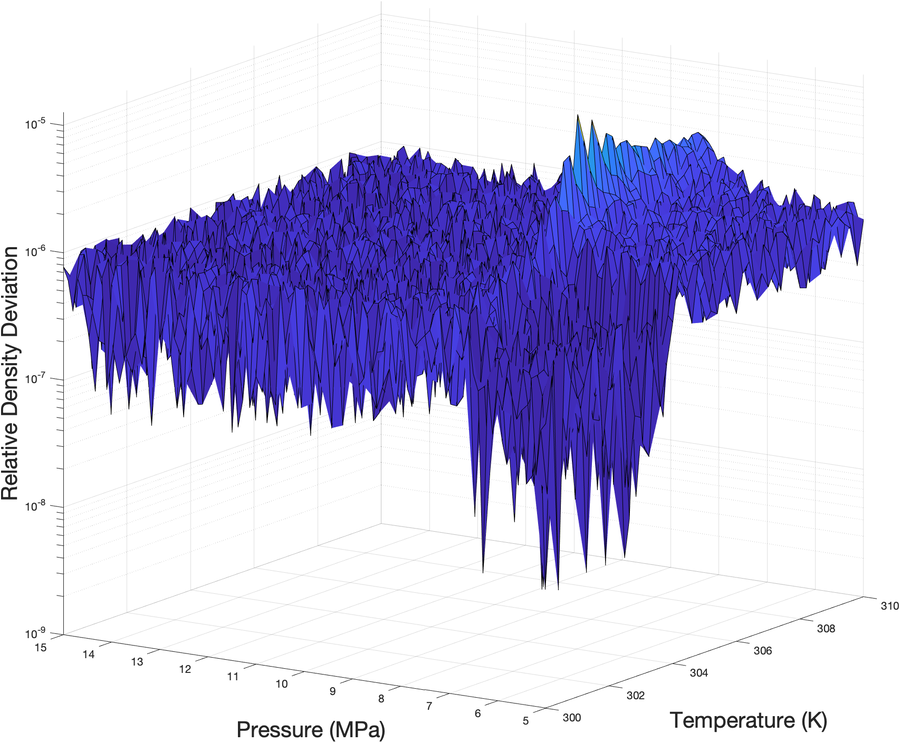
Density as a function of T, P:
- The Figure below shows the relative deviation between SCFProperties and NIST over a temperature span of 300 to 310 K with a resolution of 0.2 K and over a pressure span of 5 to 15 MPa with a 0.1 MPa resolution.
- Maximum relative deviation 13 x10-6 at 304.8 K and 7.5 MPa
- Average relative deviation 0.7 x10⁻⁶
- For 290 < T < 330 (with a 1 K resolution) & 1 < P < 50 (1.0 MPa resolution), the maximum deviation obseved was 4 x10⁻⁶ with an average deviation of 0.6 x10⁻⁶
- For 220 < T < 1100 (with a 20 K resolution) & 10 < P < 800 (10 MPa resolution), the maximum deviation obseved was 1.5 x10⁻⁶ with an average deviation of 0.6 x10⁻⁶
Internal Energy
Note: The reference temperature and pressure used by NIST differs from that used in SCFProperties and by Span & Wagner.
- Figure to the right shows the absolute deviation between SCFProperties and NIST over a temperature span of 300 to 310 K with a resolution of 0.2 K and over a pressure span of 5 to 15 MPa with a 0.1 MPa resolution.
- Minimum deviation 506.77876 kJ/kg at 304.8 K and 7.5 MPa
- Average deviation 506.77989 kJ/kg
- For 290 < T < 330 (with a 1 K resolution) & 1 < P < 50 (1.0 MPa resolution), the minimum deviation obseved was 506.77958 kJ/kg with an average deviation of 506.77988 kJ/kg
- For 220 < T < 1100 (with a 10 K resolution) & 10 < P < 800 (10 MPa resolution), the maximum deviation obseved was 506.77965 kJ/kg with an average deviation of 506.77984 kJ/kg

Enthalpy
Note: The reference temperature and pressure used by NIST differs from that used in SCFProperties and by Span & Wagner.
- Figure to the right shows the absolute deviation between SCFProperties and NIST over a temperature span of 300 to 310 K with a resolution of 0.2 K and over a pressure span of 5 to 15 MPa with a 0.1 MPa resolution.
- Minimum deviation 506.77858 kJ/kg at 304.8 K and 7.5 MPa
- Average deviation 506.77989 kJ/kg
- For 290 < T < 330 (with a 1 K resolution) & 1 < P < 50 (1.0 MPa resolution), the minimum deviation obseved was 506.77951 kJ/kg with an average deviation of 506.77994 kJ/kg
- For 220 < T < 1100 (with a 10 K resolution) & 10 < P < 800 (10 MPa resolution), the maximum deviation obseved was 506.77969 kJ/kg with an average deviation of 506.78027 kJ/kg

Entropy
Note: The reference temperature and pressure used by NIST differs from that used in SCFProperties and by Span & Wagner.
- Figure to the right shows the absolute deviation between SCFProperties and NIST over a temperature span of 300 to 310 K with a resolution of 0.2 K and over a pressure span of 5 to 15 MPa with a 0.1 MPa resolution.
- Minimum deviation 2.7390005 kJ/kg/K at 304.8 K and 7.5 MPa
- Average deviation 2.7390050 kJ/kg/K
- For 290 < T < 330 (with a 1 K resolution) & 1 < P < 50 (1.0 MPa resolution), the minimum deviation obseved was 2.739004 kJ/kg/K with an average deviation of 2.739005 kJ/kg/K
- For 220 < T < 1100 (with a 10 K resolution) & 10 < P < 800 (10 MPa resolution), the maximum deviation obseved was 2.739003 kJ/kg/K with an average deviation of 2.739005 kJ/kg/K

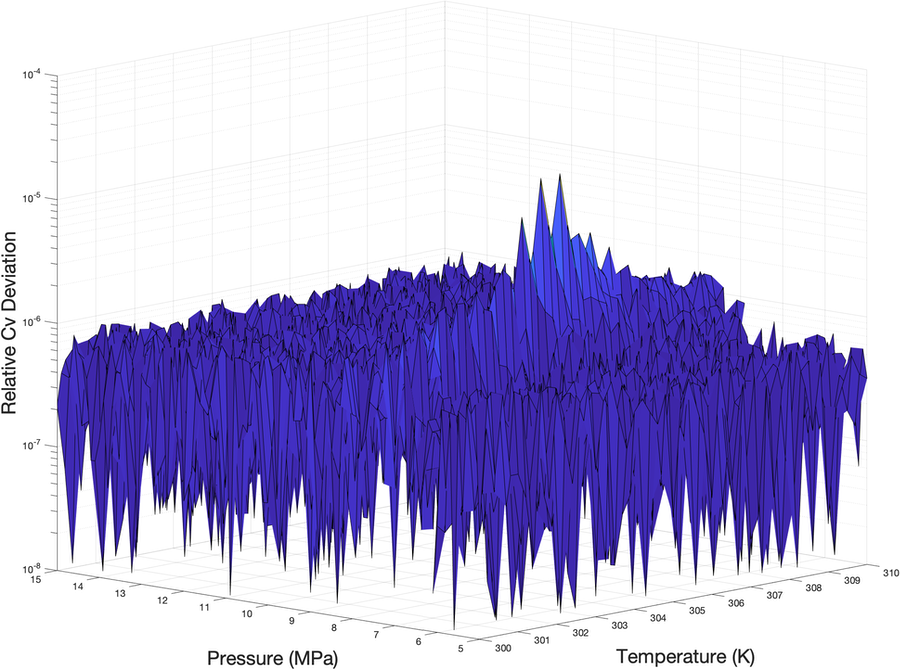
Heat Capacity (Cv)
- Figure to the right shows the relative deviation between SCFProperties and NIST over a temperature span of 300 to 310 K with a resolution of 0.2 K and over a pressure span of 5 to 15 MPa with a 0.1 MPa resolution.
- Maximum relative deviation 22 x10-6 at 304.8 K and 7.5 MPa
- Average relative deviation 0.6 x10⁻⁶
- For 290 < T < 330 (with a 1 K resolution) & 1 < P < 50 (1.0 MPa resolution), the maximum deviation observed was 2 x10⁻⁶ with an average deviation of 0.4 x10⁻⁶
- For 220 < T < 1100 (with a 20 K resolution) & 10 < P < 800 (10 MPa resolution), the maximum deviation obseved was 1.1 x10⁻⁶ with an average deviation of 0.3 x10⁻⁶
Heat Capacity (Cp)
- Figure to the right shows the relative deviation between SCFProperties and NIST over a temperature span of 300 to 310 K with a resolution of 0.2 K and over a pressure span of 5 to 15 MPa with a 0.1 MPa resolution.
- Maximum relative deviation 170 x10-6 at 304.8 K and 7.5 MPa
- Average relative deviation 2.7 x10⁻⁶
- For 290 < T < 330 (with a 1 K resolution) & 1 < P < 50 (1.0 MPa resolution), the maximum deviation obseved was 15 x10-6 with an average deviation of 1.1 x10⁻⁶
- For 220 < T < 1100 (with a 20 K resolution) & 10 < P < 800 (10 MPa resolution), the maximum deviation obseved was 4 x10⁻⁶ with an average deviation of 0.3 x10⁻⁶

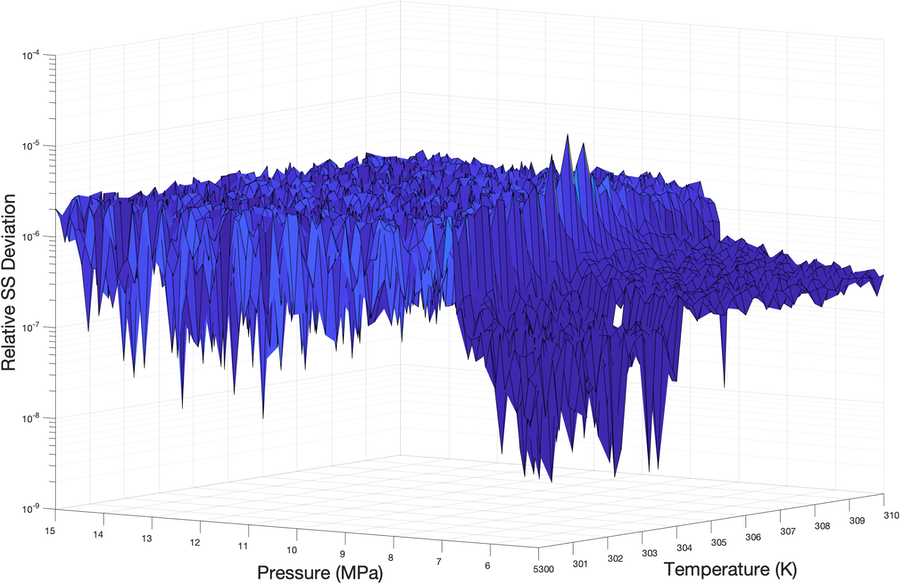
Speed of Sound
- Figure to the right shows the relative deviation between SCFProperties and NIST over a temperature span of 300 to 310 K with a resolution of 0.2 K and over a pressure span of 5 to 15 MPa with a 0.1 MPa resolution.
- Maximum relative deviation 16 x10-6 at 304.8 K and 7.5 MPa
- Average relative deviation 1.2 x10⁻⁶
- For 290 < T < 330 (with a 1 K resolution) & 1 < P < 50 (1.0 MPa resolution), the maximum deviation obseved was 3.3 x10⁻⁶ with an average deviation of 1.1 x10⁻⁶
- For 220 < T < 1100 (with a 20 K resolution) & 10 < P < 800 (10 MPa resolution), the maximum deviation obseved was 3 x10⁻⁶ with an average deviation of 0.7 x10⁻⁶